![]()
The goal of VarReg is to provide methods for fitting semi-parametric mean and variance models, with normal or censored data. This has also been extended to allow a regression in the location, scale and shape parameters. This algorithm is based upon an EM (Expectation Maximisation) algorithm, so is more stable than other similar methods like GAMLSS.
Kristy Robledo https://github.com/kristyrobledo
NHMRC Clinical Trials Centre, University of Sydney
You can install the released version of VarReg from CRAN with:
install.packages("VarReg")And the development version from GitHub with:
# install.packages("devtools")
devtools::install_github("kristyrobledo/VarReg")This is a basic example to read in the mcycle dataset and perform a linear model in the mean and the variance:
library(VarReg)
#> Welcome to the 'VarReg' package to perform semi-parametric regression
## read in dataset
data(mcycle)
## run a model with linear mean and linear variance:
linmodel<-semiVarReg(mcycle$accel, mcycle$times, meanmodel="linear", varmodel="linear",
  maxit=10000)
Now we can plot the model:
plotVarReg(linmodel)
##can also add CI
plotVarReg(linmodel, ci=TRUE, ci.type = "im")
#> [1] "CI=true, type=information matrix"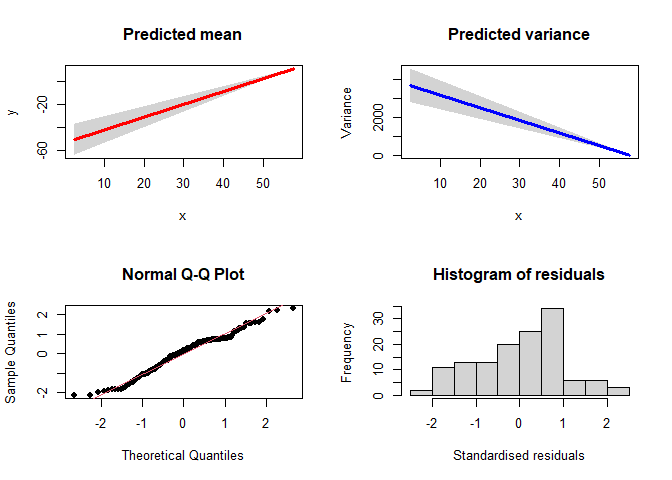
Or we can look at the results:
linmodel$loglik
#> [1] -683.5092

linmodel$mean
#>    Intercept mcycle$times
#>    -53.69517      1.11797

linmodel$variance
#>    Intercept mcycle$times
#>   3824.07225    -66.39011
We can also run a model with semi-parametric mean (4 internal knots) and semi-parametric variance (2 knots):
semimodel<-semiVarReg(mcycle$accel, mcycle$times, meanmodel="semi", varmodel="semi",
knots.m=4, knots.v=2, maxit=10000)
plotVarReg(semimodel)
## run a model with semi-parametric mean (4 internal knots) and semi-parametric monotonic
## variance (2 knots):
## not run
##semimodel_inc<-semiVarReg(mcycle$accel, mcycle$times, meanmodel="semi", varmodel="semi",
##knots.m=4, knots.v=2, mono.var="inc")
Lastly, we can fit a model with a model in the location, scale and shape. Im not going to run this, just show the code, as it takes a while to run on my laptop!
 ##  LSS model followed by the basic plot command
#lssmodel<-lssVarReg(mcycle$accel, mcycle$times,  locationmodel="linear", scale2model="linear", shapemodel="constant", maxit=10000)
#plotlssVarReg(lssmodel, xlab="Time in seconds", ylab="Acceleration")
Enjoy!