![]()
![]()
ggpointless is an extension of the ggplot2 package
providing additional layers.
You can install ggpointless from CRAN with:
install.packages("ggpointless")Or install development version from Github with
# install.packages("pak")
pak::pkg_install("flrd/ggpointless")The package groups into two categories:
Visual effects — purely aesthetic layers that change how data looks without transforming it:
geom_area_fade() – area plots with a gradient fillgeom_point_glow() – adds a radial gradient glow to
point plotsData transformations — geoms backed by a stat that fits or transforms data:
geom_arch() & stat_arch() – draws a
catenary archgeom_catenary() & stat_catenary() –
draws a catenary curvegeom_chaikin() & stat_chaikin() –
smooths paths using Chaikin’s corner cutting algorithmgeom_fourier() & stat_fourier() – fits
a Fourier series to x/y observations and
renders the reconstructed curvegeom_lexis() & stat_lexis() – draws a
Lexis diagramgeom_pointless() & stat_pointless() –
emphasises selected observations with pointsSee vignette("ggpointless")
for details and examples.
library(ggpointless)
#> Loading required package: ggplot2

# set consistent theme for all plots
cols <- c("#311dfc", "#a84dbd", "#d77e7b", "#f4ae1b")
theme_set(
  theme_minimal() +
    theme(geom = element_geom(fill = cols[1])) +
    theme(palette.fill.discrete = c(cols[1], cols[3])) +
    theme(palette.colour.discrete = cols)
)geom_arch() draws a catenary arch (inverted catenary
curve) between successive points. Hence it’s mirroring
geom_catenary().
df_arch <- data.frame(x = seq_len(4), y = c(1, 1, 0, 2))
p <- ggplot(df_arch, aes(x, y)) +
    geom_point(size = 3) +
  ylim(0, 3.5)

p + geom_arch()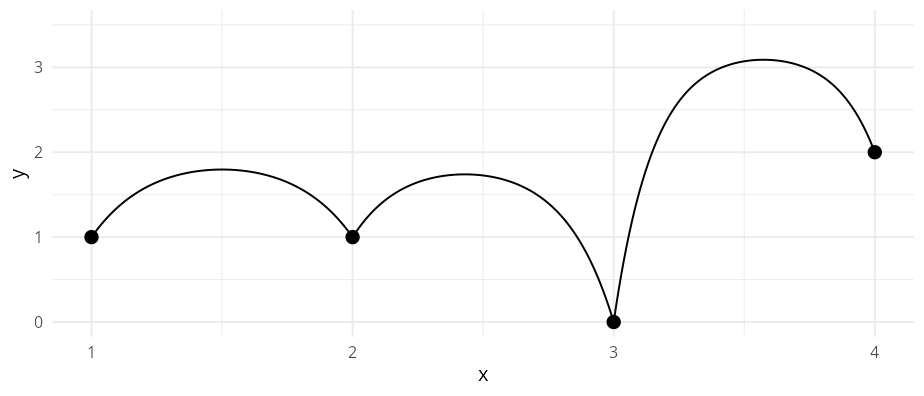
By default the arch length is twice the Euclidean distance. You can
change that for each segment using the arguments
arch_length or arch_height (vertical rise
above the highest endpoint of each segment).
df_arch <- data.frame(x = seq_len(4), y = c(1, 1, 0, 2))
ggplot(df_arch, aes(x, y)) +
  geom_arch(
    arch_height = c(1.5, NA, 0.5),
    arch_length = c(NA, 6, NA)
    ) +
  geom_point(size = 3) +
  ylim(0, 3.5)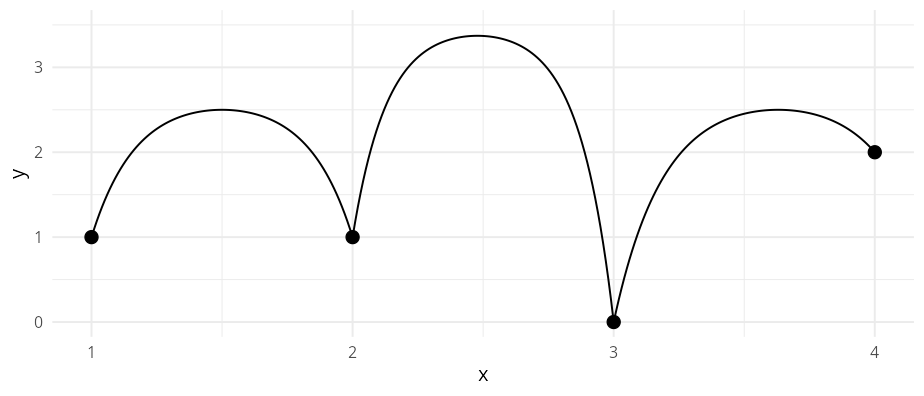
geom_area_fade() behaves like geom_area()
but fills each area with a vertical linear
gradient.
set.seed(42)
df_fade <- data.frame(
x = seq_len(60),
y = cumsum(rnorm(60, sd = 0.35))
)
p <- ggplot(df_fade, aes(x, y))
p + geom_area_fade()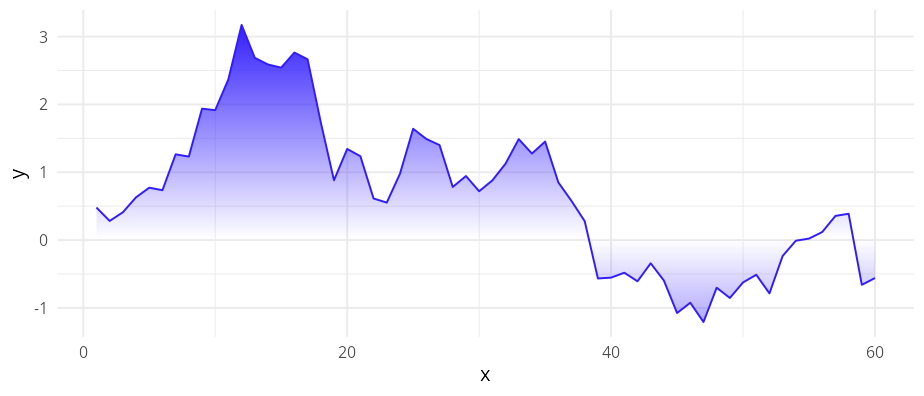 By default, the gradient fully transparent at at
 y = 0 (the
baseline) and proportionally opaque at the data values. That is, opacity
scales with absolute distance from zero, so e.g. y = -1 and
y = +1 always receive the same alpha.
You can control the alpha value the fill fades to using the
alpha_fade_to argument. By that logic you can effectively
reverse the direction of the gradient. The outline colour is unaffected
from the alpha logic.
p + geom_area_fade(alpha = 0, alpha_fade_to = 1)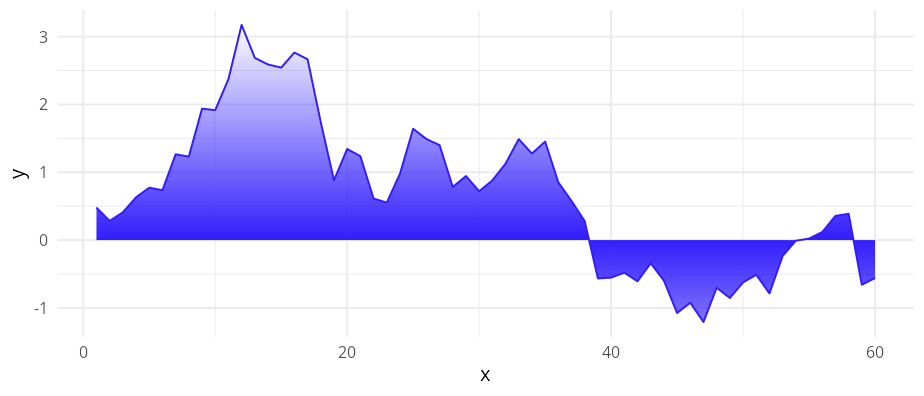
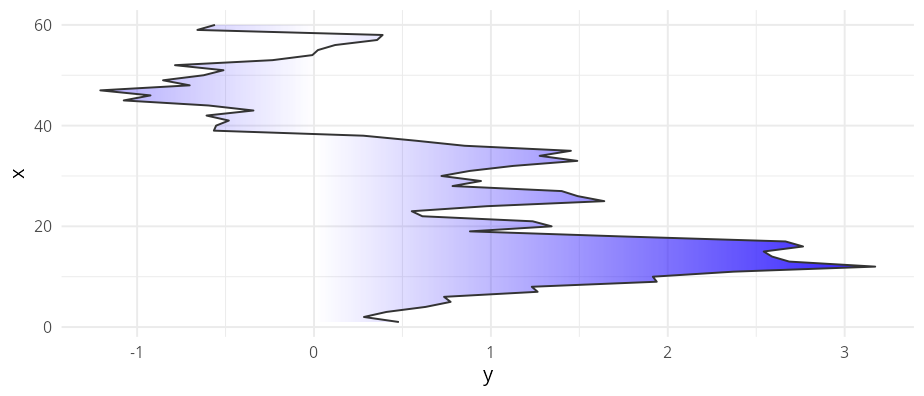
geom_area_fade() supports the orientation
argument familiar from other geom_* functions. With
orientation = "y", you create a horizontal area chart where
the gradient fades from x = 0 toward the data values.
p + geom_area_fade(
  aes(y, x),
  orientation = "y",
  colour = "#333333" # changes outline colour
  )
Since ggplot2
version 4.0.0 was released both geom_area() and
geom_ribbon() allow a varying fill aesthetic
within a group. geom_area_fade() creates a 2D-gradient in
such cases which combines the vertical and horizontal gradients.
p + geom_area_fade(aes(fill = y), colour = cols[1]) +
  scale_fill_continuous(palette = scales::colour_ramp(cols))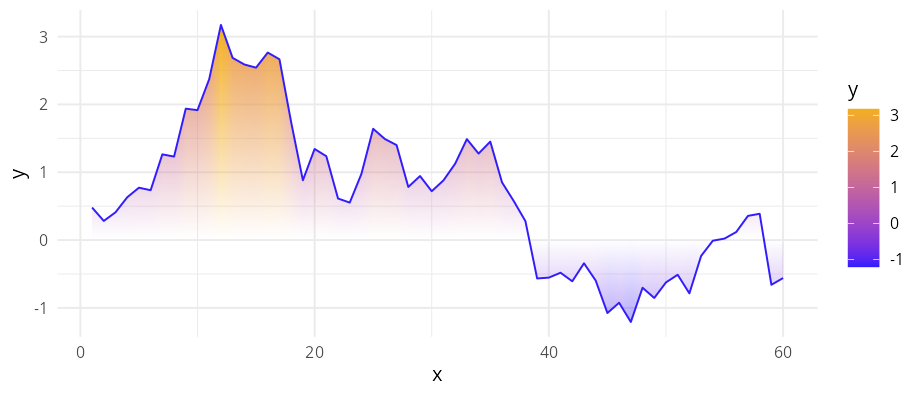
Note – Not all graphic devices support this kind of gradient, see
vignette("ggpointless")for more details and examples.
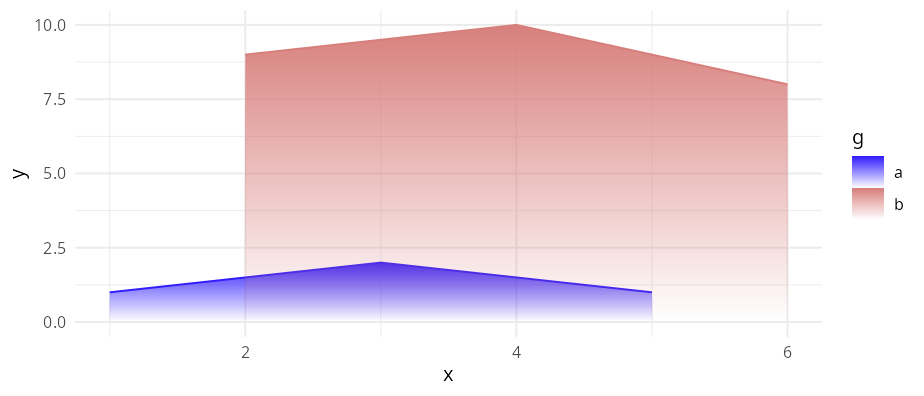
When your data contains multiple groups those are stacked
(position = "stack") and aligned
(stat = "align") – just like geom_area() does
it. By default, the alpha fade scales to the global maximum across
all groups (alpha_scope = "global"), so equal
|y| always maps to equal opacity.
df1 <- data.frame(
  g = c("a", "a", "a", "b", "b", "b"),
  x = c(1, 3, 5, 2, 4, 6),
  y = c(2, 5, 1, 3, 6, 7)
)

ggplot(df1, aes(x, y, fill = g)) +
  geom_area_fade()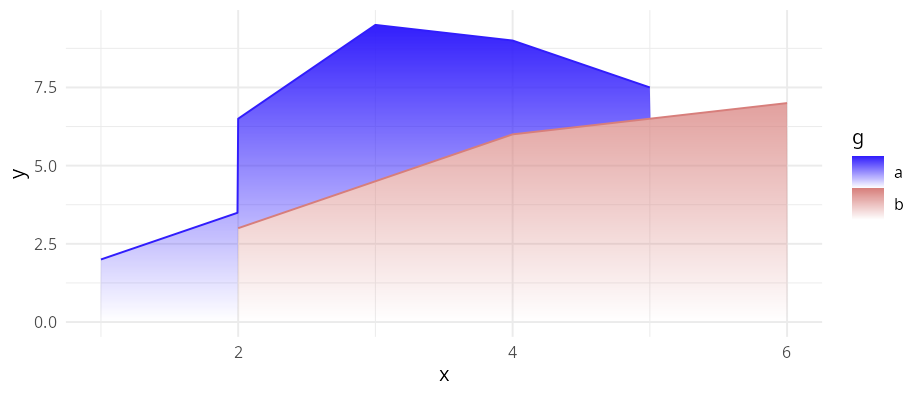
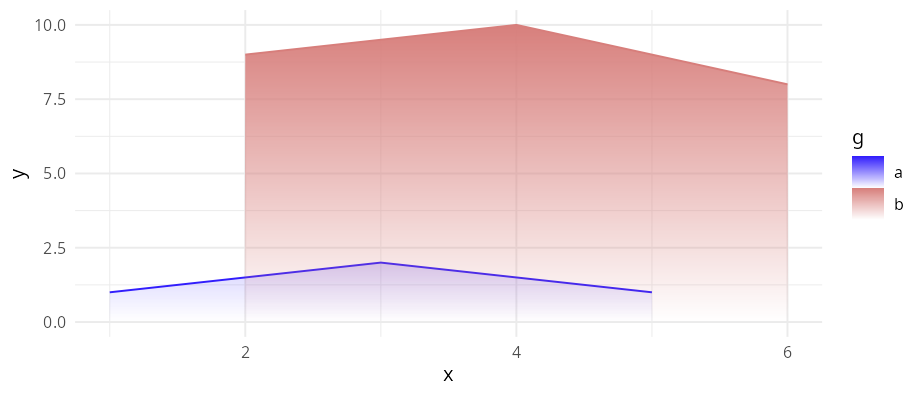
When groups have very different amplitudes or you may not use the
default position = "stack" but
stat = "identity" instead, this can make smaller groups
nearly invisible next to dominant groups.
df_alpha_scope <- data.frame(
  g = c("a", "a", "a", "b", "b", "b"),
  x = c(1, 3, 5, 2, 4, 6),
  y = c(1, 2, 1, 9, 10, 8)
)
p <- ggplot(df_alpha_scope, aes(x, y, fill = g))
p + geom_area_fade(
  alpha_scope = "global", # default
  position = "identity"
)
Setting alpha_scope = "group" lets the algorithm
calculate the alpha range for each group separately.
p <- ggplot(df_alpha_scope, aes(x, y, fill = g))

# alpha_scope = "group": each group uses the alpha range independently
p + geom_area_fade(
  alpha_scope = "group",
  position = "identity"
  )
geom_catenary() draws a flexible curve that simulates a
chain or rope hanging loosely between successive points. By default, the
chain length is twice the Euclidean distance between each
x/y pair. The shape can be controlled via
chain_length or sag, i.e vertical drop below
the lowest endpoint of each segment.
set.seed(5)
df_catenary <- data.frame(x = 1:4, y = sample(4))
ggplot(df_catenary, aes(x, y)) +
  geom_catenary() +
  geom_point(size = 3)
The sag argument can be used to define each segment’s
drop based on the smallest value of each segment. NA keeps
the default. If you provide sag and
chain_length for the same segment, then sag
wins.
ggplot(df_catenary, aes(x, y)) +
  geom_catenary(
    sag = c(2, .5, NA),
    chain_length = c(NA, 4, 6)) +
  geom_point(size = 3)
#> Both `sag` and `chain_length` supplied for 1 segment; using `sag`.
#> This message is displayed once every 8 hours.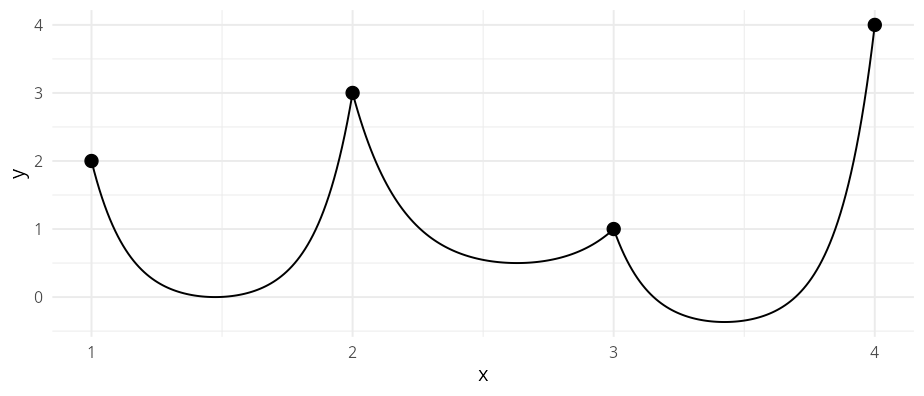
geom_chaikin() applies Chaikin’s corner cutting
algorithm to turn a ragged path or polygon into a smooth one. The
closed argument controls whether the path is treated as a
closed polygon, or an open path.
lst <- list(
  data = list(
    whale = data.frame(x = c(.5, 4, 4, 3.5, 2), y = c(.5, 1, 1.5, .5, 3)),
    closed_square = data.frame(x = c(0, 0, 1, 1), y = c(2, 3, 3, 2)),
    open_triangle = data.frame(x = c(3, 3, 5), y = c(2, 3, 3)),
    closed_triangle = data.frame(x = c(3.5, 5, 5), y = c(0, 0, 1.5))
  ),
  color = cols,
  mode = c("closed", "closed", "open", "closed")
)

ggplot(mapping = aes(x, y)) +
  lapply(lst$data, \(i) {
    geom_polygon(data = i, fill = NA, linetype = "12", color = "#333333")
  }) +
  Map(f = \(data, color, mode) {
    geom_chaikin(data = data, color = color, mode = mode)
  }, data = lst$data, color = lst$color, mode = lst$mode) +
  geom_point(data = data.frame(x = 1.5, y = 1.5)) +
  coord_equal()
geom_fourier() fits a Fourier series (via fft())
to the supplied x/y observations and renders
the reconstructed smooth curve. By default all harmonics up to the
Nyquist limit are used, giving an exact interpolating fit; reducing
n_harmonics progressively smooths the result.
The animation below shows how geom_fourier()
approximates a square wave as the number of harmonics grows from
n = 1 to the Nyquist limit:

The source script that generates the animation is at
inst/scripts/gen_fourier_gif.R.
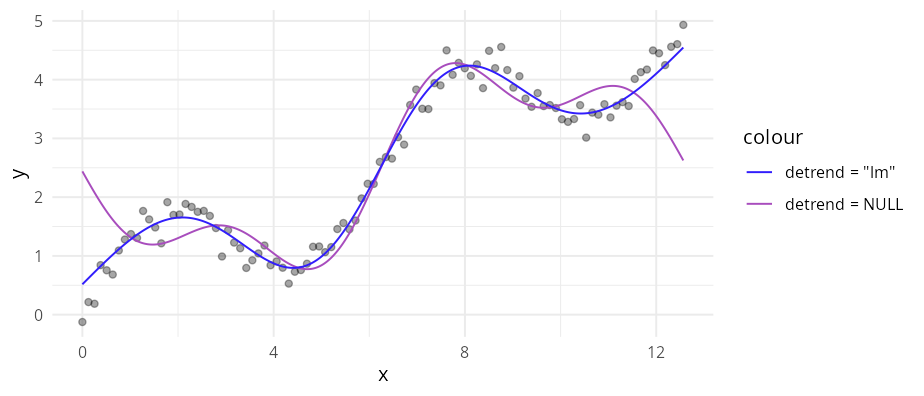
An optional detrend argument removes slow non-periodic
trends before the transform; detrend accepts one of
"lm" or "loess".
set.seed(1)
x_d <- seq(0, 4 * pi, length.out = 100)
df_d <- data.frame(
  x = x_d,
  y = sin(x_d) + x_d * 0.4 + rnorm(100, sd = 0.2)
)

ggplot(df_d, aes(x, y)) +
  geom_point(alpha = 0.35) +
  geom_fourier(
    aes(colour = "detrend = NULL"),
    n_harmonics = 3
  ) +
  geom_fourier(
    aes(colour = "detrend = \"lm\""),
    n_harmonics = 3,
    detrend = "lm"
  )
geom_lexis() is a combination of a segment and a point
layer. Given a start value and an end value, it draws a 45° line
indicating the duration of an event. Required aesthetics are
x and xend; y and
yend are calculated automatically.
df2 <- data.frame(
  key = c("A", "B", "B", "C", "D"),
  x = c(0, 1, 6, 5, 6),
  xend = c(5, 4, 10, 8, 10)
)

ggplot(df2, aes(x = x, xend = xend, color = key)) +
  geom_lexis(aes(linetype = after_stat(type)), size = 2) +
  coord_equal() +
  scale_x_continuous(breaks = c(df2$x, df2$xend)) +
  scale_linetype_identity() +
  theme(panel.grid.minor = element_blank())
See also the LexisPlotR
package.
geom_point_glow() is a drop-in replacement for geom_point()
that adds a radial gradient glow behind each point using grid::radialGradient().
The glow colour, transparency (glow_alpha), and radius
(glow_size) can be set independently of the point itself;
by default the glow inherits the point colour and size.
ggplot(mtcars, aes(wt, mpg, colour = factor(cyl))) +
  geom_point_glow(glow_size = 5, glow_alpha = .5) +
  coord_cartesian(clip = "off")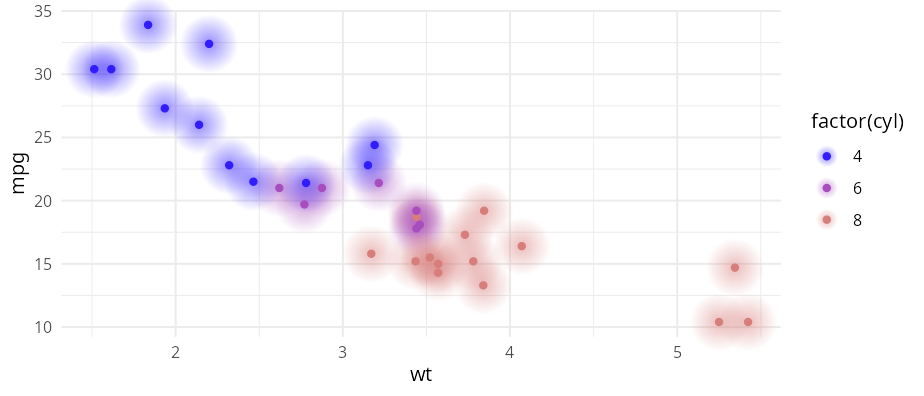
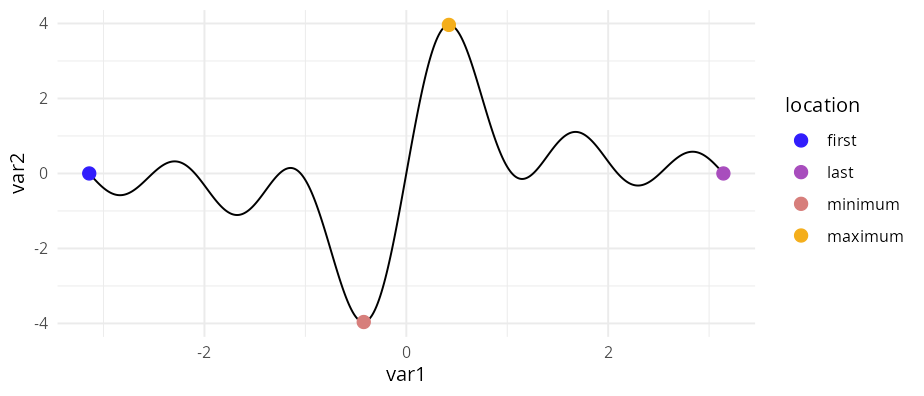
geom_pointless() lets you highlight observations, by
default using a point layer. Hence it behaves like
geom_point() but accepts a location argument:
"first", "last" (default),
"minimum", "maximum", or "all"
(shorthand for all four).
x <- seq(-pi, pi, length.out = 500)
y <- outer(x, 1:5, \(x, y) sin(x * y))

df1 <- data.frame(
  var1 = x,
  var2 = rowSums(y)
)

ggplot(df1, aes(x = var1, y = var2)) +
  geom_line() +
  geom_pointless(aes(color = after_stat(location)),
    location = "all",
    size = 3
  )
Please note that this project is released with a Contributor Code of Conduct. By participating in this project you agree to abide by its terms.