This package generates and plot palettes of optimally distinct colours in perceptually uniform colour space, based on iwanthue. This is done through k-means clustering of CIE Lab colour space, according to user-selected constraints on hue, chroma, and lightness.
iwanthue palettes can be added directly onto ggplot2 objects via the
function scale_colour_iwanthue.
The current CRAN version of hues can be installed
with:
install.packages('hues')The development version of hues can be installed using
install_github from the devtools
package:
# install.packages('devtools') # uncomment if devtools isn't already installed
devtools::install_github('johnbaums/hues')The examples below show palettes corresponding to some presets given at the iwanthue website.
library(hues)
iwanthue(5, plot=TRUE)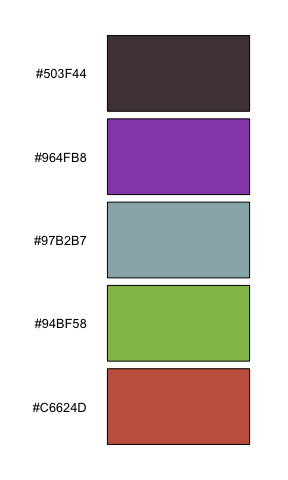
iwanthue(5, 0, 240, 0, 24, 0, 100, plot=TRUE) # shades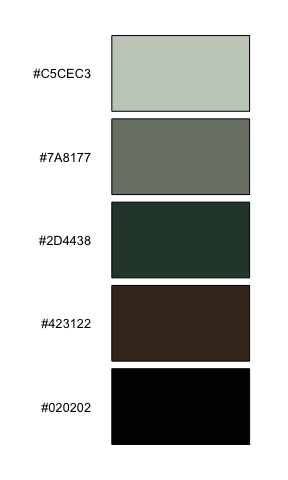
iwanthue(5, 0, 360, 0, 54, 67, 100, plot=TRUE) # pastel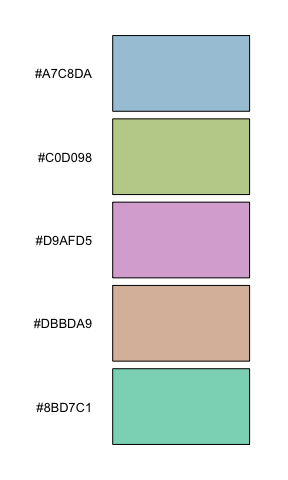
iwanthue(5, 0, 360, 54, 180, 27, 67, plot=TRUE) # pimp
iwanthue(5, 0, 360, 36, 180, 13, 73, plot=TRUE) # intense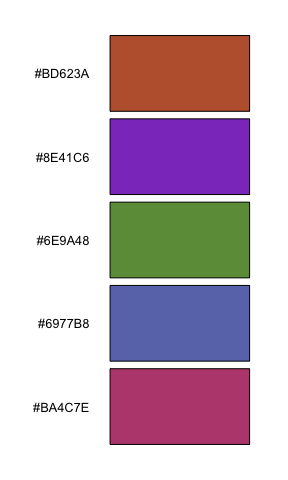
iwanthue(3, 0, 300, 60, 180, 73, 100, plot=TRUE) # fluoro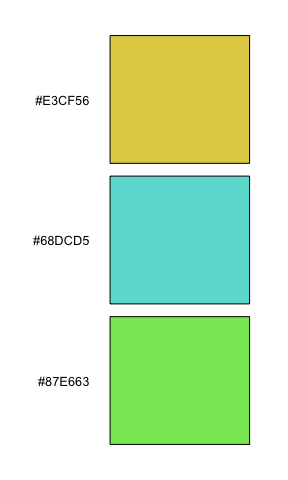
iwanthue(3, 220, 260, 12, 150, 0, 53, plot=TRUE) # blue ocean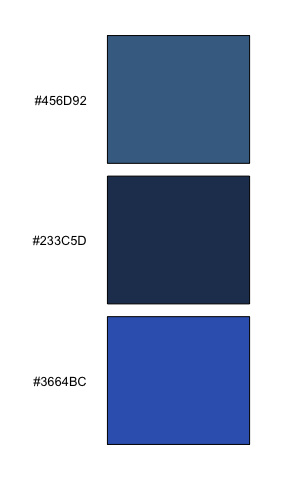
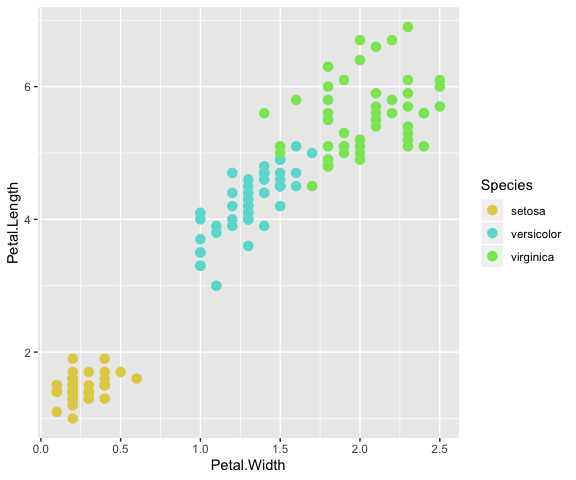
ggplot2 integrationlibrary(ggplot2)
ggplot(iris, aes(x=Petal.Width, y=Petal.Length)) +
geom_point(aes(color=Species), size=3) +
scale_colour_iwanthue()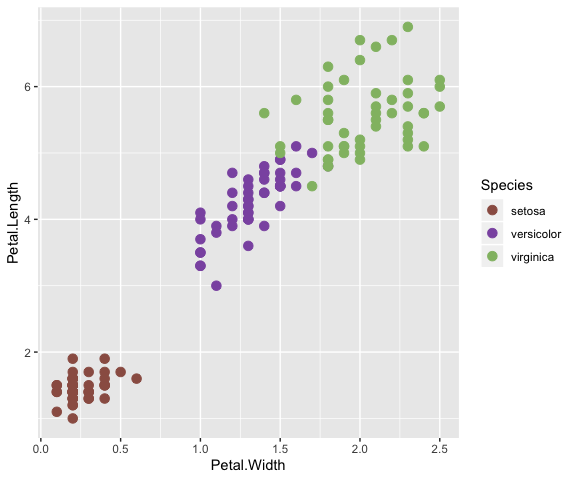
ggplot(iris, aes(x=Petal.Width, y=Petal.Length)) +
  geom_point(aes(color=Species), size=3) +
  scale_colour_iwanthue(hmax = 90)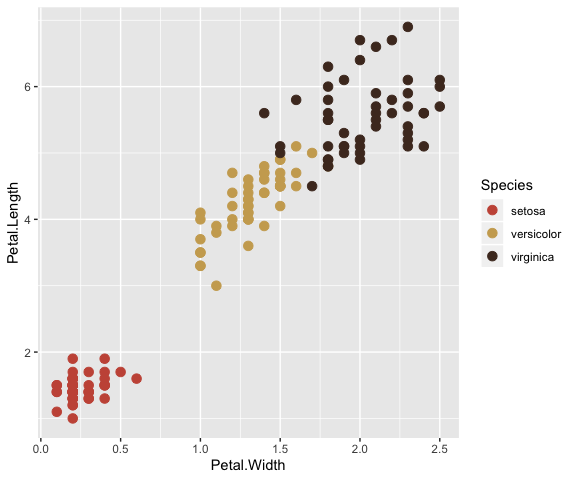
ggplot(iris, aes(x=Petal.Width, y=Petal.Length)) +
  geom_point(aes(color=Species), size=3) +
  scale_colour_iwanthue(hmin=0, hmax=300, cmin=60, cmax=180, lmin=73, lmax=100)