The goal of vctsfr is to display time series and, optionally, their future values and forecasts for those future values along with prediction intervals for the forecasts. vctsfr is especially useful when you want to visually compare the forecasts of several models on collections of time series. The package contains a web-based GUI to facilitate this comparison.
The package can be intalled from CRAN with:
install.packages("vctsfr")For installing the development version of vctsfr from GitHub:
# install.packages("devtools")
devtools::install_github("franciscomartinezdelrio/vctsfr")The best way of learning to use the package is to read its vignette.
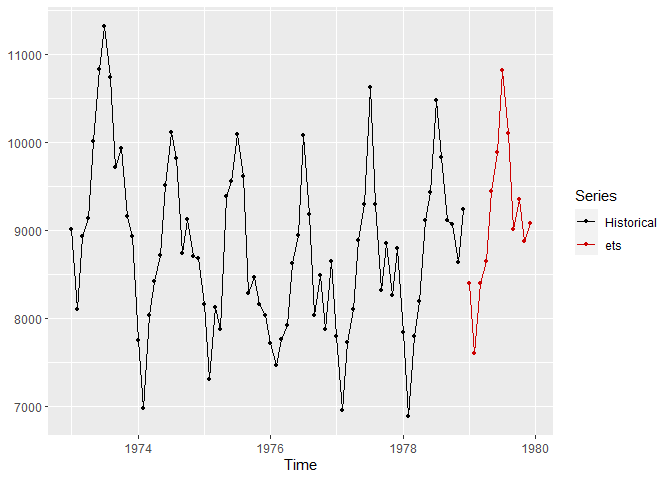
Here, we show some functions in action. The plot_ts()
function is useful to display a time series and a forecast for its
future values:
library(vctsfr)
library(forecast)
#> Registered S3 method overwritten by 'quantmod':
#>   method            from
#>   as.zoo.data.frame zoo
ets_fit <- ets(USAccDeaths)
ets_f <- forecast(ets_fit, h = 12)
plot_ts(USAccDeaths, prediction = ets_f$mean, method = "ets")
To compare several forecasts for a time series you can use the
plot_predictions() function:
library(vctsfr)
library(forecast)
timeS <- window(USAccDeaths, end = c(1977, 12)) # historical values
fut <- window(USAccDeaths, start = c(1978, 1))  # "future" values
ets_fit <- ets(timeS)                           # exponential smoothing fit
ets_f <- forecast(ets_fit, h = length(fut))     # exponential smoothing forecast
arima_fit <- auto.arima(timeS)                  # ARIMA fit
arima_f <- forecast(arima_fit, h = length(fut)) # ARIMA forecast
plot_predictions(timeS, future = fut,
                 predictions = list(ets = ets_f$mean, arima = arima_f$mean)                 )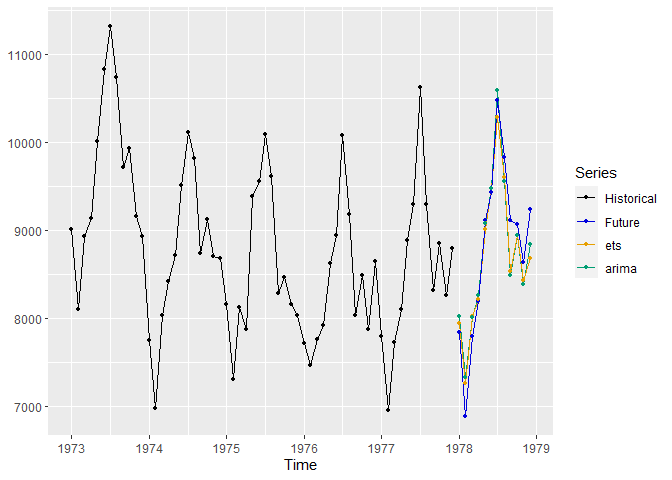
It is also possible to create a collection of time series (holding optionally their future values, forecasts and prediction intervals for the forecasts) and display them:
# A collection of two time series
collection <- list(ts_info(USAccDeaths), ts_info(UKDriverDeaths))
plot_collection(collection, number = 2)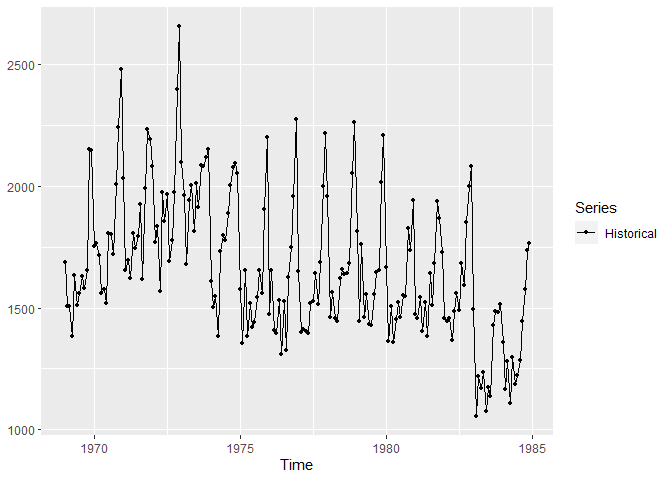
However, the best way of navigating and displaying the information in a collection of time series is through the web-based GUI:
GUI_collection(collection)